
Looking for a reliable monitoring solution? Zabbix — is a powerful open-source software that provides comprehensive capabilities for tracking the performance and availability of servers, network devices, applications, and other components of IT infrastructure. With the Zabbix API and integration with Zabbix and Grafana, you can collect, store, process, and analyze data in real-time, ensuring timely detection of issues and minimizing downtime. Zabbix server supports various platforms, including Zabbix for Windows and Ubuntu Zabbix, making it a versatile monitoring tool.
Key features of Zabbix include:
Flexibility and scalability:
Suitable for both small businesses and large corporations. With Zabbix Cloud, you can easily scale your infrastructure.Wide functionality:
Monitoring of servers, network devices, databases, applications, and business metrics. Integration with Zabbix and Grafana allows you to visualize data for deeper analysis, using Zabbix with Grafana.Notification automation:
Sending alerts via e-mail, SMS, messengers, and other channels when specified conditions are met, using the Zabbix API.Integrations and customization:
Support for third-party plugins and templates to extend monitoring capabilities. Zabbix software allows you to customize the system to meet specific needs.
Thanks to these features, Zabbix is widely used to ensure the reliability and availability of IT infrastructure.
Getting Started
Installing Zabbix via Marketplace
For quick setup of the Zabbix server, use a ready-made image from the Marketplace. This avoids manual configuration of components and speeds up the installation process.
Select the Zabbix server image in the Marketplace.
Specify the login parameters (password or SSH key) that you will use to connect to the server.
Connecting to the server via SSH
After deploying the server, connect via SSH.
Linux/MacOS: Use the built-in terminal.
Windows: It is recommended to use programs like PuTTY or OpenSSH.
Example command for connection:
ssh root@<server IP address>
After connecting to the server, you will see the following message:
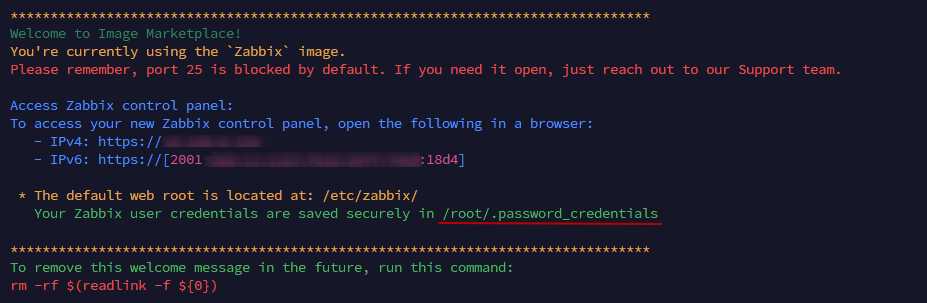
3. Obtaining login credentials
After connecting, run the command to obtain the administrator credentials:
cat ~/.password_credentials
or
cat /root/.password_credentials
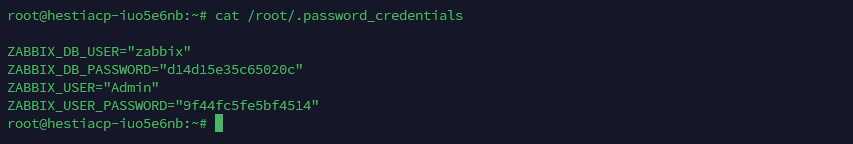
You will receive the username and password for access:
Username: Admin
Password: YourSecurePassword
Initial Zabbix setup
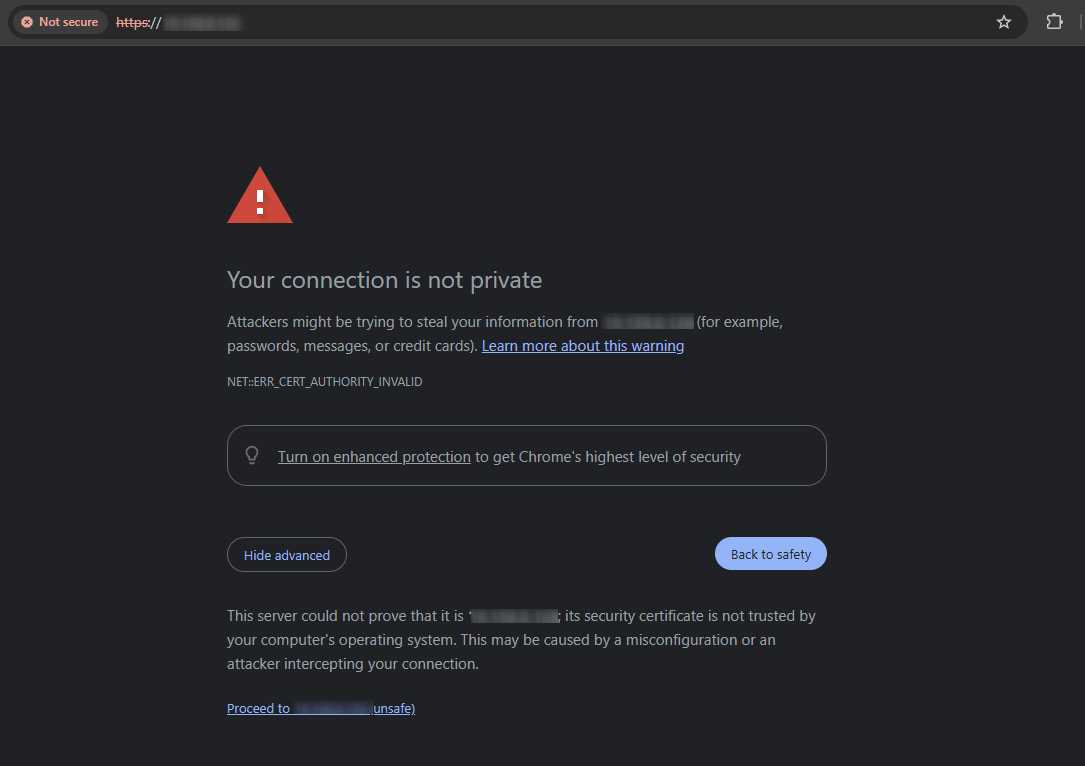
1. Go to the Zabbix web interface by entering the IP address of your server in the browser. For example:
https://11.22.33.44
2. If a warning about the SSL certificate appears, confirm the transition.
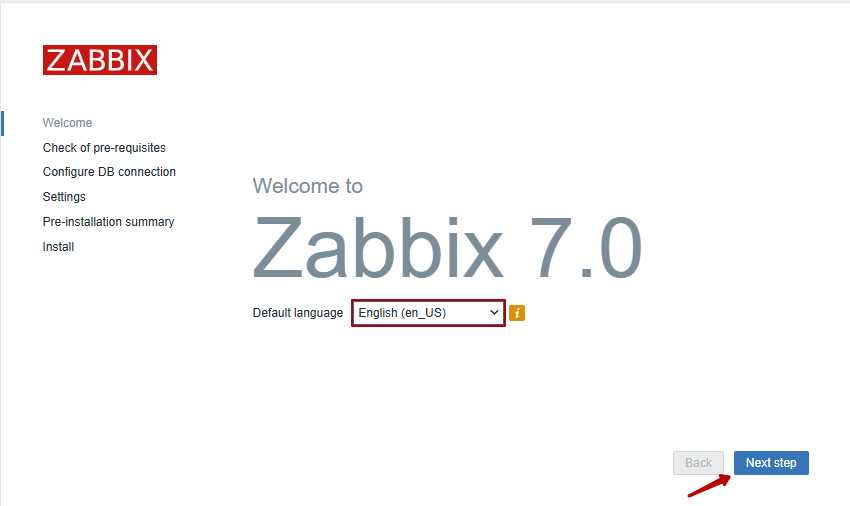
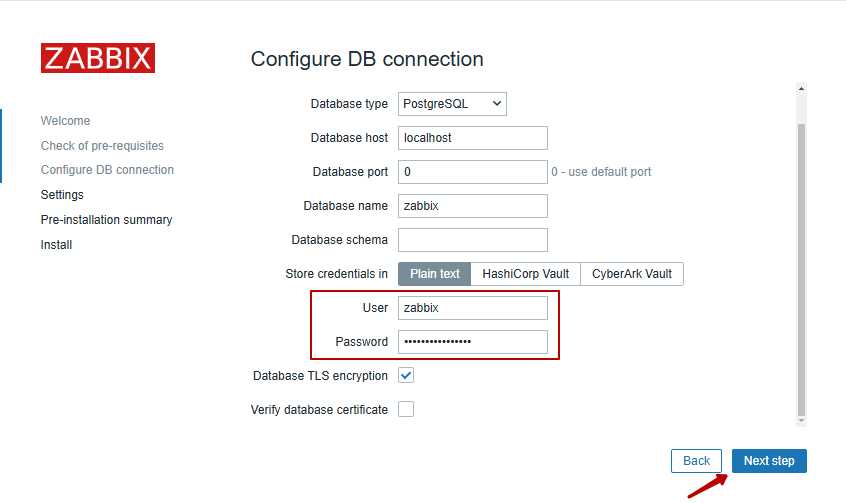
3. The setup interface will appear on the screen. Follow the steps:
Select the interface language.
Check the database connection using the credentials from the file.
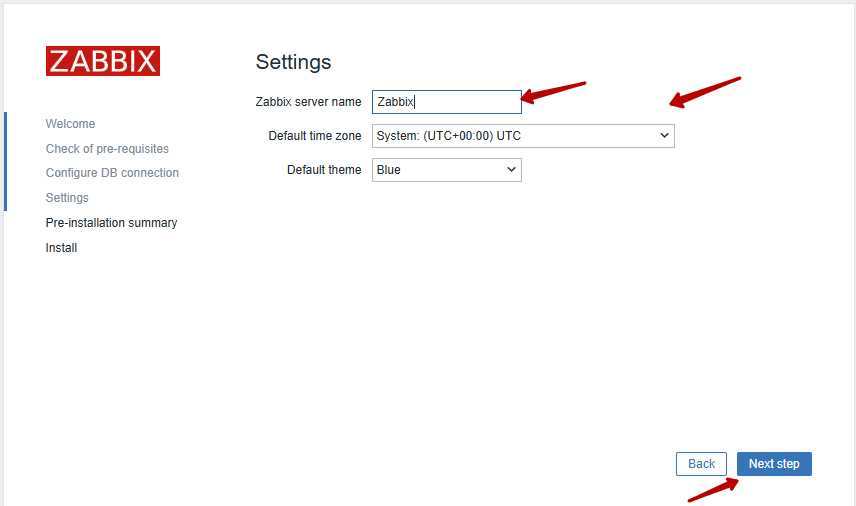
Specify the Zabbix server name and configure the time zone.
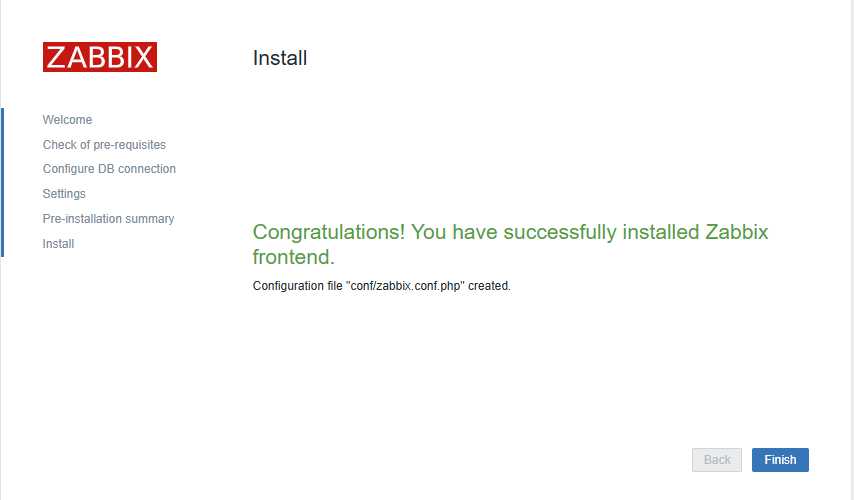
4. Click Finish to complete the setup process.
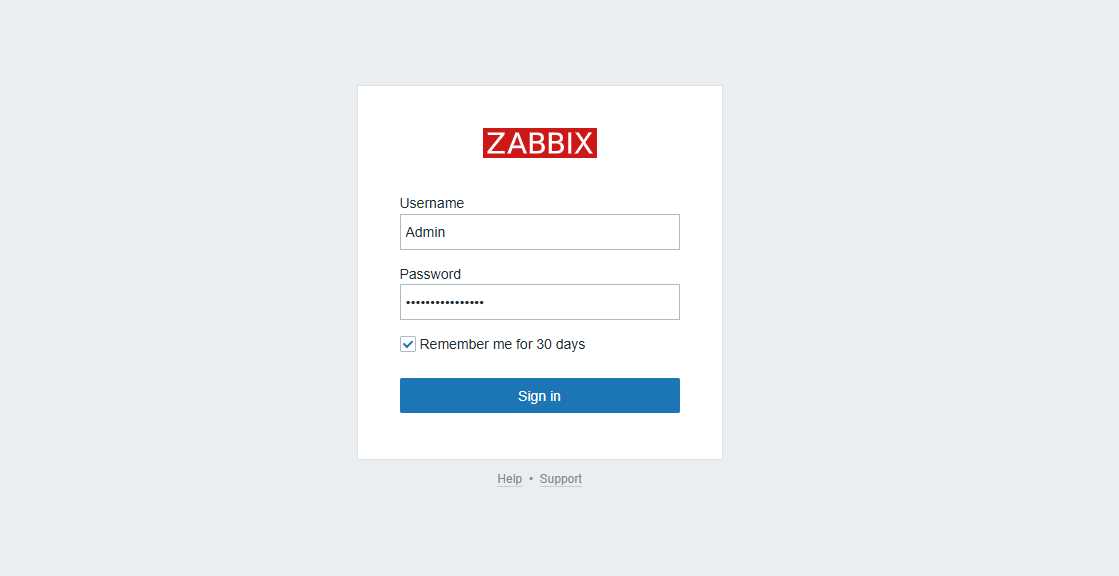
5. Then you will see a window to log in to the Zabbix panel. Enter the username Admin and the password from the file.
Configuring the Zabbix monitoring system
Adding devices for monitoring
After completing the initial configuration, you can add hosts (servers, network devices, or applications) that need to be monitored:
1. Go to Data collection → Hosts.
2. Click Create host and fill in the following fields:
Host name: Specify a unique name for the device.
Group: For example, Servers or Network Devices.
IP address: Specify the IP address of the device.
3. Bind monitoring templates (for example, a template for a Linux server) to automatically collect key metrics.
Configuring notifications
Zabbix allows you to configure notifications to alert administrators about issues:
1. In the menu, select Configuration → Actions.
2. Create a new action:
Specify conditions, for example, CPU usage > 90%.
Set trigger rules to activate notifications.
3. Add a channel for sending notifications (e-mail, messengers, SMS).
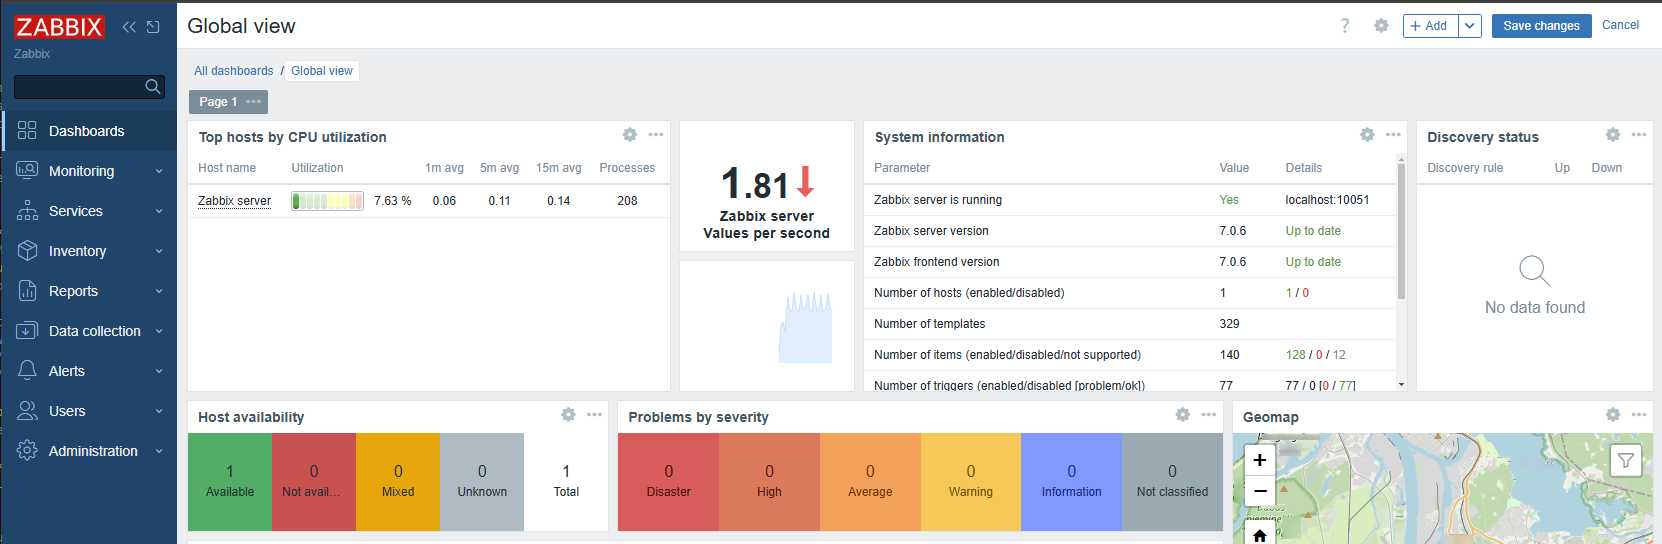
Monitoring and analysis
After adding devices and installing agents, the system will start collecting data in real-time.
1. Graphs and reports
Go to Monitoring → Graphs to view key metrics (for example, CPU load, memory usage).
Use reports to analyze performance.
2. Real-time notifications
Receive notifications about critical events on specified communication channels.
3. Performance analysis
Use data analysis features to identify bottlenecks and forecast system load.
Additional recommendations
1. Ensuring security
Restrict access to the web interface using a firewall.
Regularly update Zabbix to the latest version.
2. Backup
Set up backup of the Zabbix database to prevent data loss.
3. Extending functionality
Use additional templates and plugins for monitoring specific systems and applications.
Conclusion
Zabbix provides powerful tools for comprehensive monitoring of IT infrastructure. The system helps administrators to timely identify issues, minimize the risks of failures, and improve equipment performance. With its flexibility and extensive customization options, as well as integration with Zabbix and Grafana, Zabbix is suitable for both small businesses and large corporations, providing reliable control over IT systems. If you are looking for an effective monitoring solution, consider Zabbix; its prices for Zabbix and the cost of Zabbix make it an attractive choice for various organizations. Using Zabbix Cloud allows you to scale your infrastructure without sacrificing performance, and support for Zabbix for Windows and Ubuntu Zabbix ensures compatibility with various operating systems.