
Looking for an effective monitoring solution? Prometheus — is a powerful monitoring system designed to manage modern IT infrastructures. Whether it's Prometheus on Linux or Prometheus monitoring Windows Server, this tool allows you to collect metrics and data from various components such as servers, databases, and microservices via HTTP requests. Thanks to its flexibility, integration with other systems like Grafana, and support for automated alerts, the Prometheus monitoring system becomes an indispensable solution for DevOps teams.
Key advantages of Prometheus
Wide monitoring capabilities:
Collecting metrics from servers, databases, applications, and microservices, including Prometheus network monitoring and Prometheus server monitoring.
Support for standardized protocols and data formats.
Flexible query format:
Using the PromQL query language for data analysis and creating customized metrics.
Automated alerts:
Setting up notifications for critical events for quick response to issues.
Integration with Grafana:
To create visual graphs and visualize metrics, simplifying data analysis.
Ease of deployment:
Ability to quickly start with ready-made solutions from the Marketplace, whether it's Prometheus on Linux or Prometheus Windows Server Monitoring.
Steps to deploy Prometheus
1. Install the Prometheus server
Deploy the server from the Marketplace.
After successful installation, you will receive connection data. They will be available/sent:
To your email address.
As a ticket in your personal account.
2. Connect to the server
Connect to the server via SSH using a client suitable for your OS:
Linux/MacOS: standard terminal.
Windows: PuTTY client or built-in OpenSSH.
Use the password set during installation or a pre-configured SSH key. If you don't know how to create a key, refer to this guide.
After logging into the server, you will see the following message:
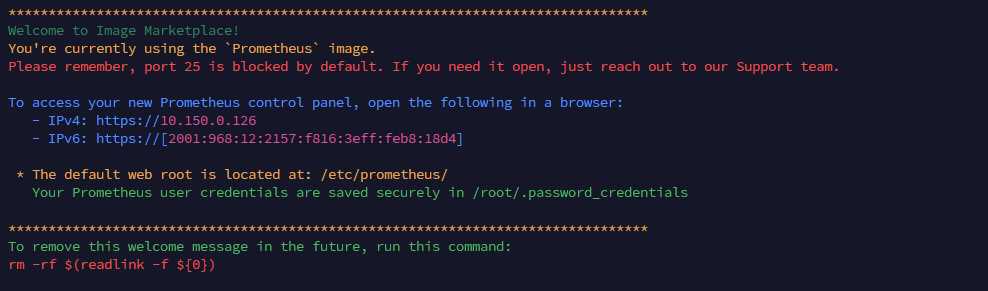
To view the connection data, execute the command:
cat /root/.password_credentials
3. Configure Prometheus
The root directory of the application is located at:
/etc/prometheus/
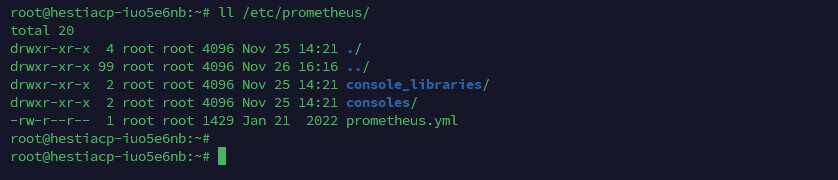
The main configuration file — prometheus.yml. In it, you can specify:
Metric sources.
Alert parameters.
Other monitoring settings.
To edit the file, execute:
vim /etc/prometheus/prometheus.yml
4. Setting up the SSL certificate
For secure connection via HTTPS, follow these steps:
Domain binding:
Ensure that the domain or subdomain points to the IP address of your server.
Set up DNS records through the hosting control panel.
Installing the Let's Encrypt certificate:
Execute the command:
certbot --nginx
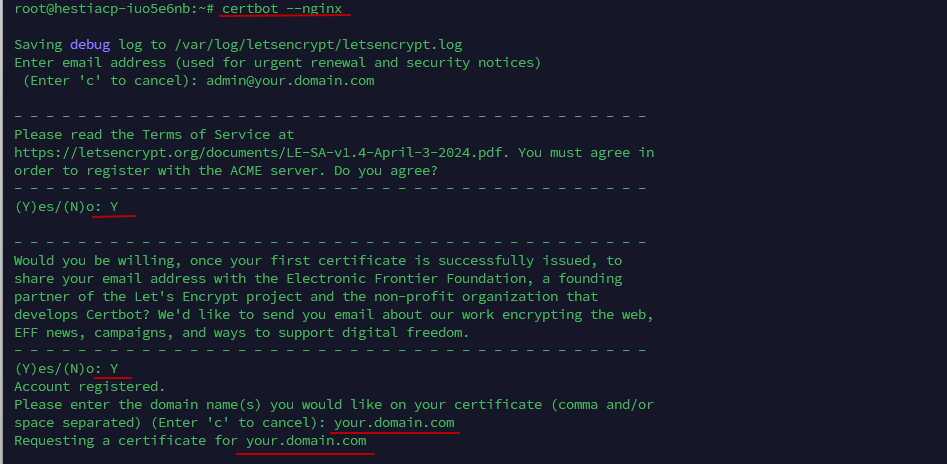
Follow the instructions:
Provide the administrator's email address.
Accept the terms of use (press Y).
Specify the domain name (e.g., your.domain.com).
Opt out of sharing the email address for analytics (N).
Wait for the process to complete (about 5 minutes).
5. Accessing the Prometheus control panel
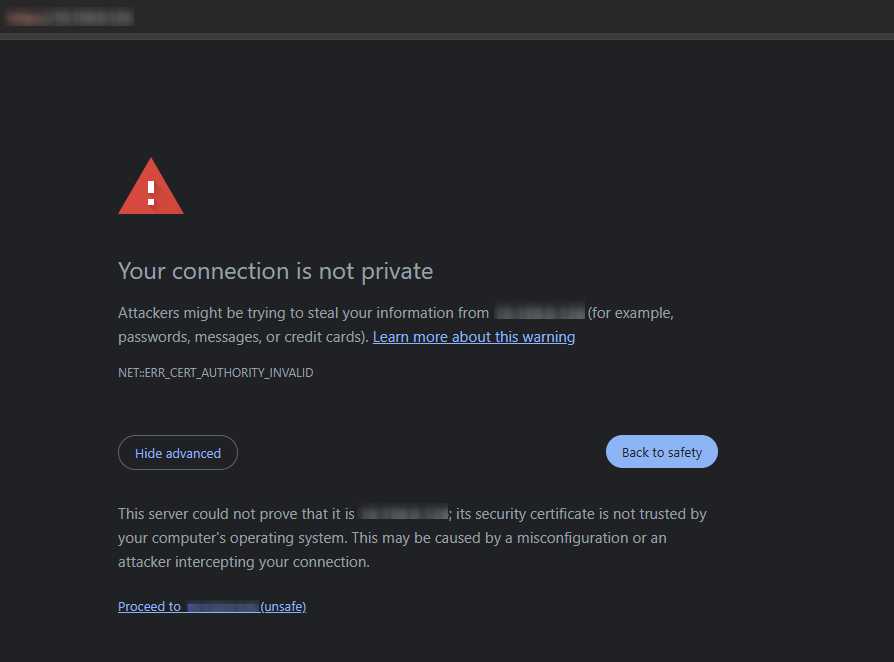
To access the web interface, enter the server's IP address in your browser, for example:
https://<your-IP>If the SSL certificate is not yet installed, the browser may show a warning that can be ignored.
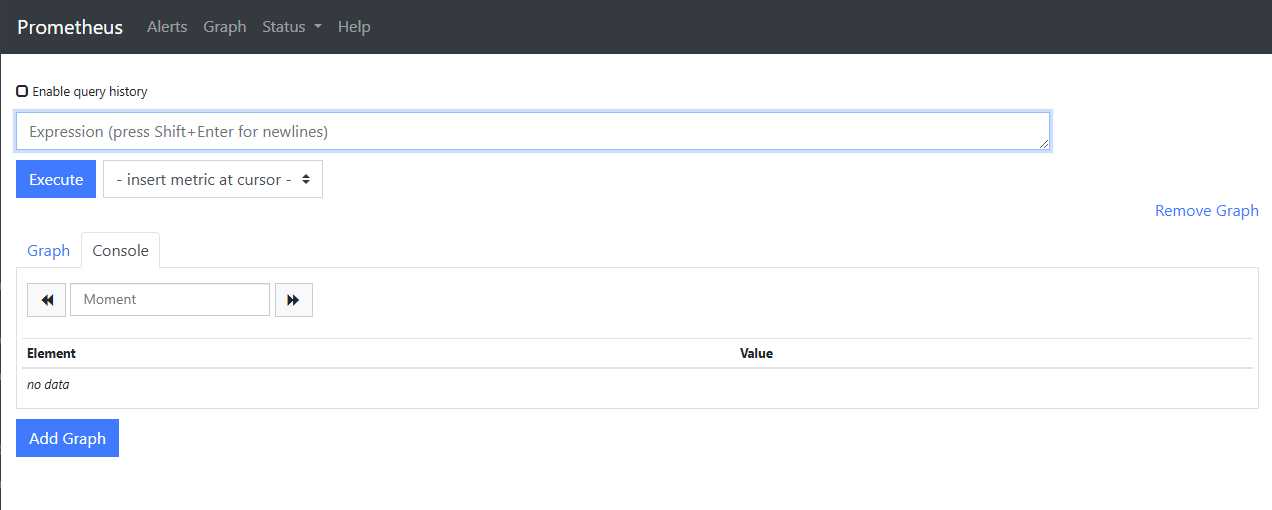
After logging in, the control panel will open where you can:
View collected metrics.
Execute queries via PromQL.
Configure integrations with other tools.
Features and recommendations
Port 25:
By default, this port is blocked. If unblocking is required, please contact technical support.
Automating alerts:
Set up Alertmanager for timely notifications about failures.
Integration with Grafana:
Use Grafana to create visual graphs and dashboards based on Prometheus data.
Updating configuration:
After making changes to prometheus.yml, restart the service:
systemctl restart prometheus
The Prometheus monitoring system — is a powerful tool that provides detailed control over the state of your infrastructure. Whether you are using Prometheus on Linux or need Prometheus monitoring Windows Server, this Prometheus system offers flexibility and reliability. Its integration with Grafana and support for automated alerts make it an ideal choice for DevOps teams. Use Prometheus network monitoring and Prometheus server monitoring to enhance the stability and performance of your systems. Prometheus — is your path to effective and reliable monitoring.