
Do you want to know what Grafana is and what it is used for? Grafana — is a powerful open-source tool for visualizing and analyzing real-time data. With the Grafana server and various Grafana plugins, you can create a centralized platform for monitoring servers, networks, and applications. It provides intuitive dashboards that make it easy to interpret data, identify issues, and make informed decisions based on analysis.
Main features of Grafana
- Support for multiple data sources
- Grafana supports integration with popular monitoring systems such as Prometheus, InfluxDB, MySQL, PostgreSQL, Elasticsearch, Loki, and others. This makes it a versatile solution for collecting and analyzing data from various sources.
- The system is suitable for both small businesses and large corporations. You can start with a single server and gradually scale the infrastructure by connecting new nodes and data sources.
- Users can easily create unique dashboards that display key metrics. Each dashboard can be tailored to specific tasks or company requirements.
- Grafana allows you to set up automatic alerts that notify the administrator when critical metric thresholds are reached via e-mail, Slack, Telegram, or other integrated systems.
- The Grafana user interface is designed for both experienced system administrators and beginners. This reduces the learning curve and allows for quicker onboarding.
How to get started with Grafana
Installing Grafana via Marketplace
To deploy Grafana, you can use ready-made images from the Marketplace. This avoids the complexities of manual server configuration and speeds up the installation process.
Deploy a server with Grafana by selecting the appropriate image in the Marketplace.
- Specify access parameters (password or SSH key) that will be used for connection.
- After creating the server, connect to it via SSH.
- Linux/MacOS: Use the terminal to connect.
- Windows: It is recommended to use programs like PuTTY or the built-in OpenSSH client.
In the terminal, execute the following command:
ssh root@<IP-address of your server>
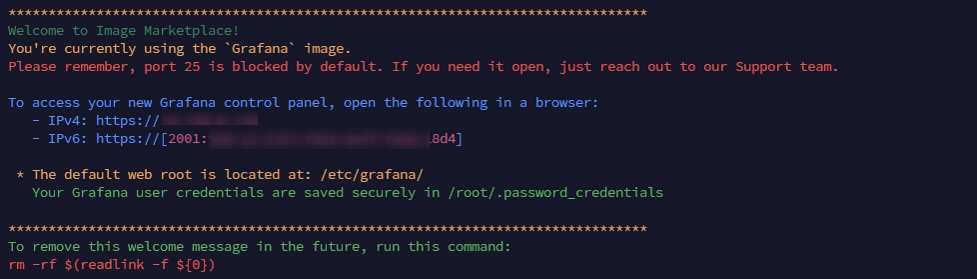
Getting login credentials for Grafana
Upon first connecting to the server, the administrator credentials are saved in the file: /root/password_credentials
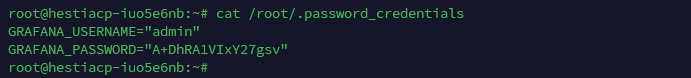
Execute the command:
cat /root/password_credentials
This will output the username and password for logging into the Grafana web interface.
- Username: admin
- Password: YourSecurePassword
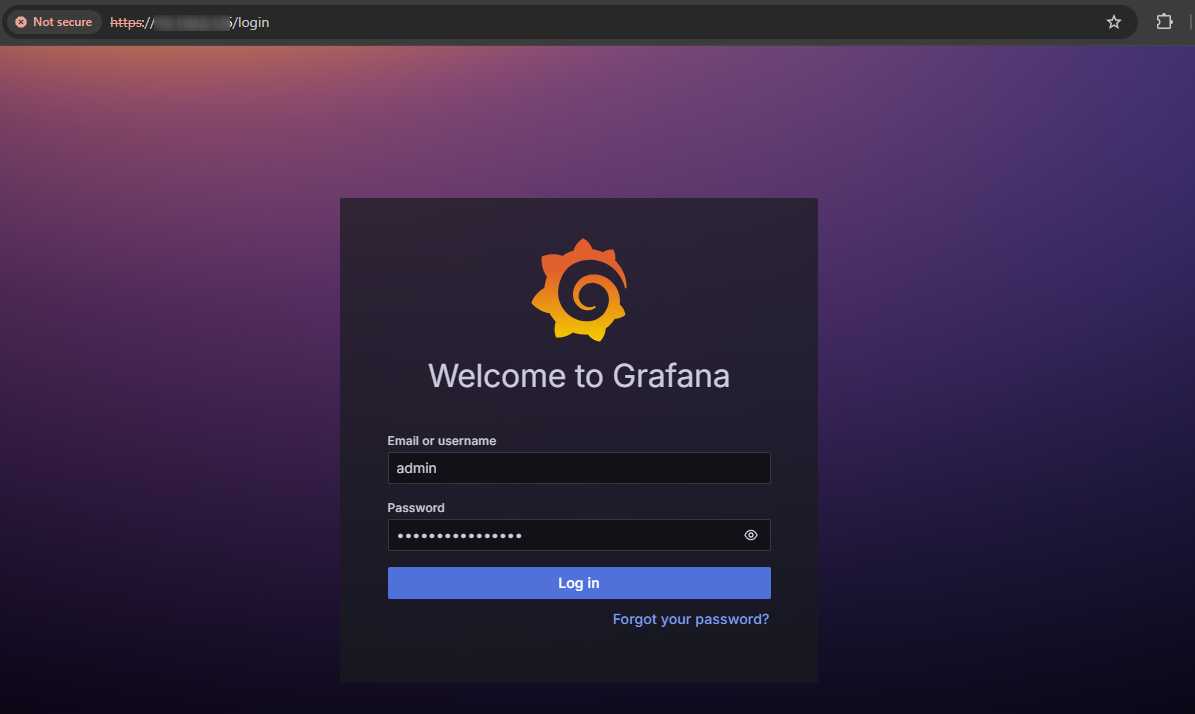
Logging into the web interface
Open your browser and enter the server's IP address, for example:
http://11.22.33.44
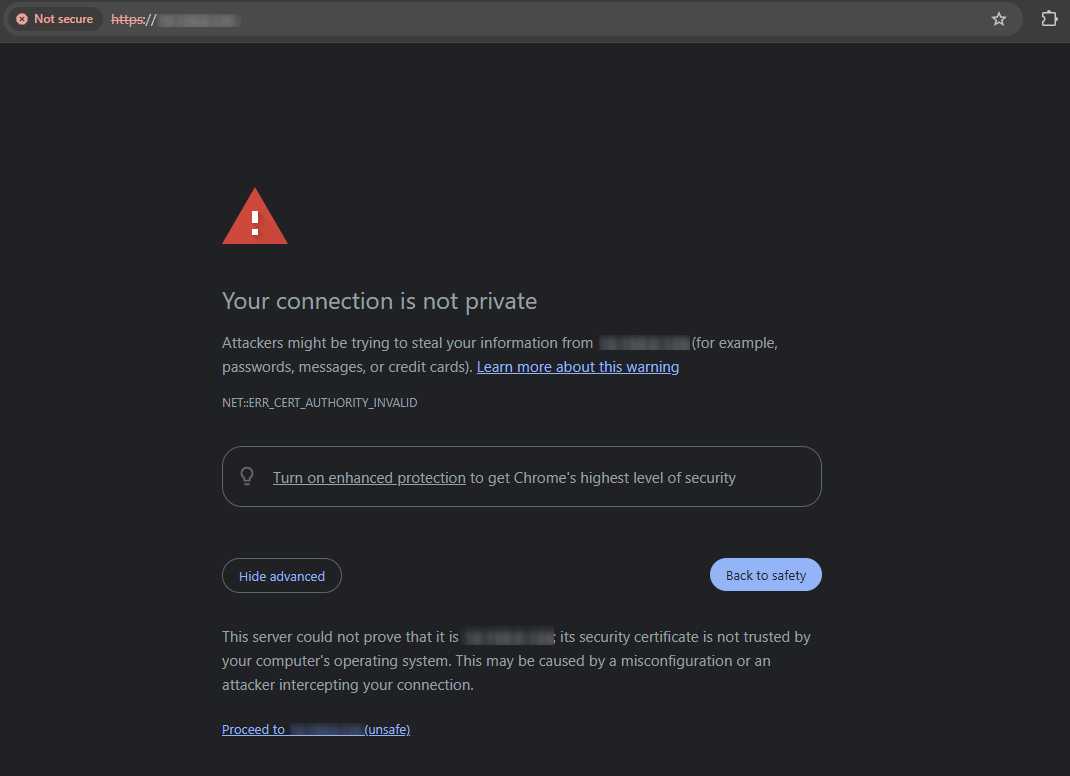
If a warning about the SSL certificate appears, confirm the transition.
Enter the credentials obtained earlier (admin / YourSecurePassword).
After logging in, you will be prompted to change the administrator password. It is highly recommended to set a strong password to enhance security.
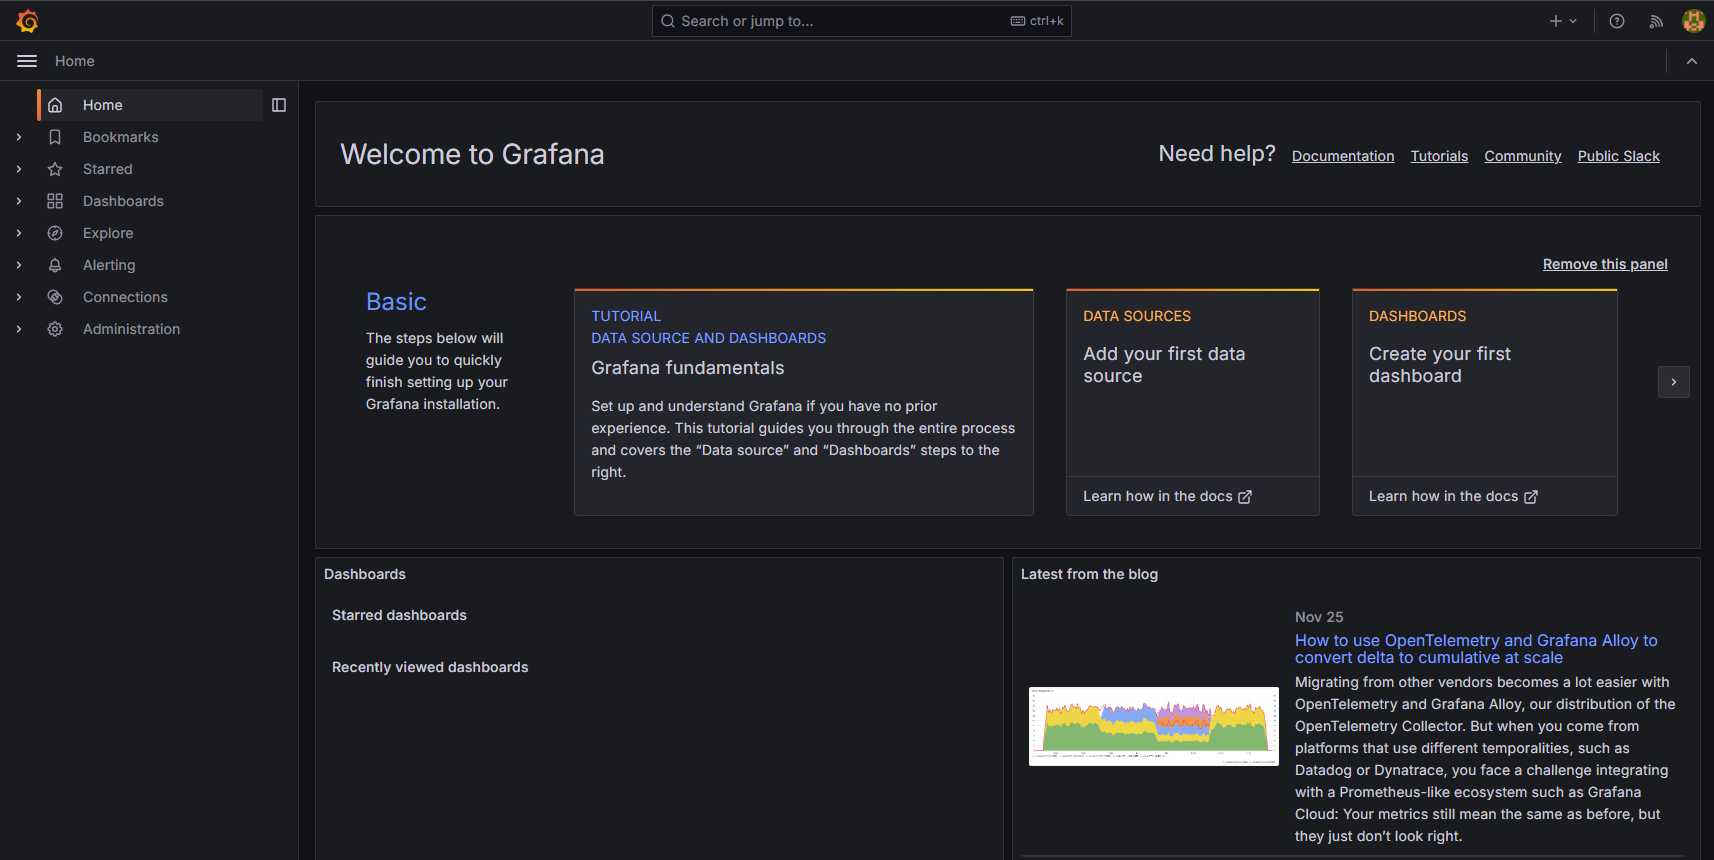
Initial setup of Grafana
Connecting data sources
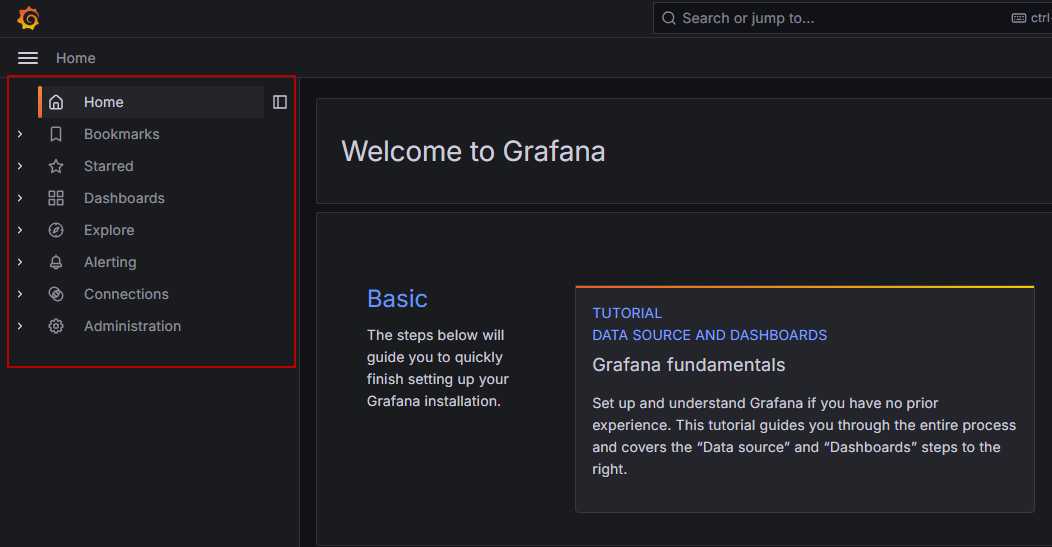
- In the menu, select Connections → Data Sources.
- Click Add Data Source.
- Select the type of data source (e.g., Prometheus, InfluxDB, or MySQL).
- Specify the connection parameters:
- Server or host address.
- Connection port.
- Login and password (if required).
Save the settings and test the connection.
Creating dashboards
- Go to the Dashboards → New Dashboard section.
- Click Add New Panel to add the first graph.
- Configure the visualization parameters:
- Specify the metric to display.
- Configure axes, titles, and labels.
- Set threshold values (if necessary).
You can create both simple graphs and complex visualizations with multiple levels of detail.
Setting up alerts
- Select the panel for which you want to set up an alert.
- Enable Alerting and set the conditions:
- The metric to monitor.
- Threshold values at which the notification will trigger.
Specify the notification delivery channel:
- E-mail.
- Slack.
- Telegram.
Ensuring security and backup
Access restriction
- To prevent unauthorized access, install a firewall and configure security features.
Updates
- Regularly update Grafana to the latest version to receive bug fixes and security improvements.
Backup
- Use built-in tools or third-party solutions for backing up data and configuration.
Grafana — is an indispensable tool for data visualization and monitoring. If you are looking for a monitoring solution with Grafana, network monitoring with Grafana, or server monitoring with Grafana, then this tool is perfect for you. With its flexible configuration, wide integration capabilities, and user-friendly interface, Grafana helps system administrators, developers, and analysts gain full control over infrastructure, promptly identify and resolve issues, and effectively analyze data in real-time.