Monitoring databases like MySQL plays a key role in ensuring the stable and efficient operation of IT systems. Current services and software are significantly dependent on the performance of databases, as various malfunctions in MySQL can cause significant reputational and financial damage.
Timely and quality monitoring of MySQL allows for the rapid detection and elimination of bottlenecks, avoiding downtime and malfunctions. Additionally, it enables load analysis, which contributes to improving the quality of resource utilization. This is especially relevant in the context of changing workloads and increasing performance demands.
1.2. Overview of popular monitoring systems
Zabbix: a powerful monitoring system with support for triggers and flexible notifications. Suitable for comprehensive infrastructure monitoring.
Grafana: provides powerful data visualization capabilities in conjunction with Prometheus, making it an excellent tool for metric analysis.
Advantages of choosing Zabbix and Grafana as tools for monitoring MySQL
These tools offer a comprehensive approach: Zabbix excels at alerting configuration, while Grafana provides user-friendly dashboards for visualizing metrics.
2. Organizing MySQL space for subsequent monitoring
2.1. Enabling and configuring MySQL performance metrics
To ensure access to key metrics, it is necessary to activate performance_schema.
Activation steps:
Open the MySQL configuration file (/etc/my.cnf or /etc/mysql/my.cnf).
Add the following parameters:
performance_schema=ONRestart MySQL:
systemctl restart mysql2.2. Installing the plugin for exporting metrics
MySQL Exporter — is a convenient tool for integrating MySQL metrics with monitoring systems such as Prometheus.
Installation steps:
Download the binary file:
wget https://github.com/prometheus/mysqld_exporter/releases/latest/download/mysqld_exporter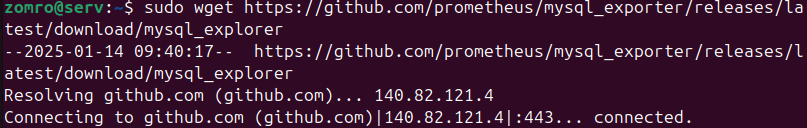
chmod +x mysqld_exporterRun the Exporter:
./mysqld_exporter --config.my-cnf=/path/to/.my.cnf
2.3. Access control
Create a user with access to metrics:
CREATE USER 'monitoring'@'localhost' IDENTIFIED BY 'password';

GRANT SELECT, PROCESS, REPLICATION CLIENT ON *.* TO 'monitoring'@'localhost';

FLUSH PRIVILEGES;
3. Zabbix and MySQL: integration
3.1. Installing and configuring the Zabbix server
Steps to install the Zabbix server:
Install Zabbix:
sudo apt update
sudo apt install zabbix-server-mysql zabbix-frontend-php zabbix-apache-conf zabbix-agent
Configure the online interface by following the Zabbix documentation.
3.2. Installing the Zabbix Agent on the MySQL server
Steps to install the agent:
Install Zabbix Agent:
sudo apt install zabbix-agentConfigure the Zabbix Agent to collect MySQL information. Add to the zabbix_agentd.conf document:
UserParameter=mysql.status[*],mysqladmin -u monitoring -ppassword status3.3. Importing templates for monitoring MySQL
Use ready-made templates:
Import the MySQL template into the Zabbix online space.
Configure key metrics: active connections, query execution time, memory usage.
4. Integrating MySQL with Grafana
4.1. Installing and configuring Grafana
Steps to install Grafana:
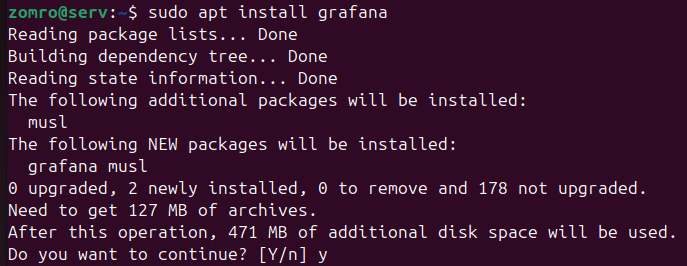
Install Grafana via the package manager:
sudo apt install grafana
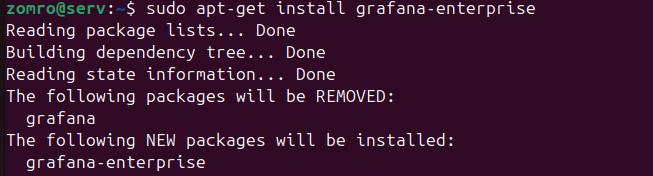
sudo apt-get install grafana-enterprise
Configure the first login to the Grafana online space.
4.2. Configuring MySQL Exporter
Configuration steps:
Ensure that MySQL Exporter is running and collecting metrics.
Configure Prometheus to collect data from the Exporter.
Example configuration for prometheus.yml:
scrape_configs:

  - job_name: 'mysql'

    static_configs:

      - targets: ['localhost:9104']
4.3. Importing dashboards into Grafana
Use ready-made dashboards from Grafana Dashboards:
Import the JSON template.
Create visualizations of key metrics, including queries per second (QPS), locks, and memory consumption.
5. Comparing techniques: Zabbix and Grafana
The choice of a system for monitoring MySQL is based on various aspects, including monitoring goals, features of the IT infrastructure, ease of use of the tool, and the skill level of the team. Let's consider the key advantages of each solution.
Zabbix or Grafana: which one to choose?
Advantages of using Zabbix:
The need for unified control of the entire IT system.
Requires detailed configuration of triggers and alerting systems.
It is important to respond quickly to critical situations, such as resource overload.
Need to monitor data in real-time and retrospectively.
If you want to choose Grafana:
The main focus is on performance analysis and data visualization.
Requires the ability to connect different data sources.
The team needs to receive convenient and clear reports on the state of MySQL.
Prometheus or another compatible data collector is already in use.
Using Zabbix and Grafana together:
In complex projects, Zabbix and Grafana can work together, providing both centralized monitoring and convenient visualizations. For example, Zabbix can be responsible for data collection and event management, while Grafana can handle creating visual dashboards for performance analysis.
6. Advanced configuration
Flexible monitoring configuration allows you to fully adapt Zabbix and Grafana tools to the needs of the infrastructure and the specifics of MySQL operation, including creating custom metrics, improving data presentation, and configuring the notification system.
7. Recommendations for optimizing monitoring
Effective monitoring of MySQL plays a key role in managing database performance. Integration with tools like Zabbix and Grafana not only ensures the collection of key indicators but also allows for deep analysis to identify bottlenecks and optimize performance. Let's consider key tips.
7.1. Optimizing MySQL monitoring
Collecting specialized metrics
For MySQL, it is necessary to configure the collection of indicators that reflect the specifics of database operation. Key metrics include:
General performance indicators:
Queries per second (QPS) — the number of queries per second.
Connections — the number of active connections.
Slow queries — the number of slow queries exceeding a specified time threshold.
Status indicators:
Threads running — the number of threads actively executing queries.
InnoDB buffer pool usage — the usage of the InnoDB buffer pool.
Table locks — the frequency of table locks.
Failures and outages:
Replication failures.
Difficulties with ongoing operations (e.g., Deadlocks).
Configuring polling intervals
For critical metrics such as QPS and the number of active connections, it is recommended to set a short polling interval (from 5 to 10 seconds). For less variable indicators, such as database size, it is advisable to use longer intervals — from 5 to 10 minutes.
Using standard plugins
In the Zabbix system, you can also use the prepared MySQL template, which allows for the automatic collection of key indicators. For deeper configuration, it is recommended to use the Zabbix agent with the additional zabbix-mysql module.
7.2. Improving alerting for MySQL
Configuring triggers for MySQL
Create specific triggers that will notify about deviations in MySQL operation:
Connections: exceeding the maximum number of connections (max_connections).
Slow queries: an increase in the number of slow queries over a certain period.
Resource usage:
Buffer pool overflow (InnoDB buffer pool).
Increased CPU load due to queries.
Adding context to alerts
Include detailed information in alerts to simplify diagnosis:
SQL queries that create high load.
Execution time of long queries.
The database server on which the deviation occurred.
Example message:
Critical: The number of slow queries on the server mysql-db01 exceeded 50 in the last 10 minutes. More details: [link to Grafana dashboard].
7.3. Improving MySQL data visualization
Creating dashboards in Grafana
Use Grafana to display key MySQL metrics:
Overall status:
Current load (QPS, number of connections).
Replication status (lag, status of slaves).
Resources:
Buffer pool usage.
Size of transaction log files (Log file size).
Errors:
Number of deadlocks.
Connection issues.
Using detailed panels
Break down the visualization into levels:
Summary dashboard: general information about the state of MySQL.
Diagnostics: load graphs, query performance indicators.
Error analysis: frequency of deadlocks, tables with the highest load.
7.4. Automating monitoring tasks
Implementing queries for data collection
Use custom SQL queries to collect additional metrics not included in standard templates:
SHOW STATUS LIKE 'Threads_running';

SHOW STATUS LIKE 'Connections';

SHOW ENGINE INNODB STATUS\G
These queries can be added to the Zabbix or Grafana configuration for regular monitoring.
Integration with notification systems
Set up notifications for critical events in MySQL in auto mode:
Configure integration with platforms like Slack, Telegram, or email for timely notifications.
Create alerts for incidents related to replication or database failures.
7.5. Prediction and anomalies
Predicting MySQL load
Use historical data to predict peak load points:
Increase in the number of connections.
Increase in the volume of data in the database.
Increase in the number of INSERT/UPDATE operations.
Detecting anomalies
Use tools like Anomaly Detection in Grafana to identify sharp deviations:
Spike in the number of slow queries.
Unexpected increase in memory consumption.
Drop in performance.
7.6. Regular auditing of MySQL monitoring
Assessing covered metrics
Check whether monitoring covers key aspects of MySQL operation:
Performance (QPS, slow queries).
Resource usage (buffer, memory, disk activity).
Errors and failures.
Testing configuration
Regularly check trigger and template settings to adapt to changes in the infrastructure.
Analyzing MySQL logs
Use MySQL logs for additional analysis:
Authentication errors.
Transaction issues.
8. Conclusion
Monitoring MySQL plays a key role in ensuring the stability, performance, and security of modern IT systems. Monitoring tools such as Zabbix and Grafana provide powerful means for collecting, analyzing, and visualizing data. This helps administrators quickly identify and resolve issues, prevent failures, and optimize database performance.
Integrating MySQL with Zabbix allows for deep tracking of the database state, creating flexible triggers for automatic notifications about critical situations. At the same time, Grafana combined with Prometheus provides convenient and clear dashboards, as well as advanced data visualization tools. This makes Grafana an excellent choice for performance analysis and trend identification.
The choice between these platforms depends on specific tasks: Zabbix is better suited for comprehensive monitoring and alerting system configuration, while Grafana is ideal for visual analysis and deep metric exploration. However, their combined use allows for the most effective control of MySQL operation and improvement of its performance.
For successful monitoring, it is important not only to configure the systems correctly but also to regularly update them, add new metrics, and adapt to changes in workload. This approach helps not only to minimize risks but also to maximize the benefits from your database.
Regardless of your metrics, Zabbix and Grafana offer the full range of necessary functionality for creating a quality MySQL monitoring system. These tools are key assistants for developers and administrators, providing convenience and reliability in database management.